news
CNN
Boeing and NASA decide to move forward with historic crewed launch of new spacecraft
NBC Universal
Her family thought her death was a tragic accident. It took years before the truth came out
USA TODAY
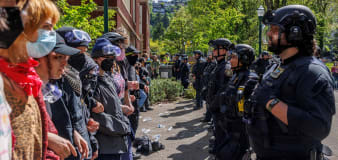
Encampment raid at NYU, hunger strike at Princeton as campus battles rage across US: Live updates
ABC News
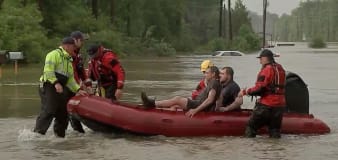
Houston area facing 'catastrophic' flood conditions as severe weather pummels Texas
USA TODAY
Utah woman accused of shooting, killing best friend as part of 'suicide pact'
Advertisement


Stay informed and up-to-date with your local news, breaking news events, global events, savings events, solar eclipse news, and in-depth coverage on a wide range of topics. From politics and technology to entertainment and science, we bring you the latest news from around the world.


